
OVERVIEW
Where the Race Is Still Open
Critical Is Not the Same as Contestable
Western policy treats critical minerals as a single category. Markets do not.
Some processing markets have already closed. In gallium, graphite, rare earths and lithium, midstream capacity is consolidated to the point where a new entrant buys resilience rather than leverage. That is a real and defensible objective, but it is not the same objective, and it should not be priced as though it were.
Other markets remain structurally contestable. Copper, nickel and chromium are open enough that capital deployed into them can still change who holds a position rather than merely reduce someone's exposure. Recent work in Resources Policy has formalised this as a contestability index, and it is the most useful filter an investor can apply to this sector: not how critical is it, but is the race still running.
Every metal in the Graal sits in the open column.
Three Metals, Three Different Problems
The three metals in the Graal fail in three different ways. Copper is short because nobody can build mines fast enough. Nickel is abundant but sits behind a single government's quota decisions. Cobalt is a byproduct of somebody else's copper mine in one country. Diversification of supply means something different in each case, and only one of the three is primarily a geology problem.
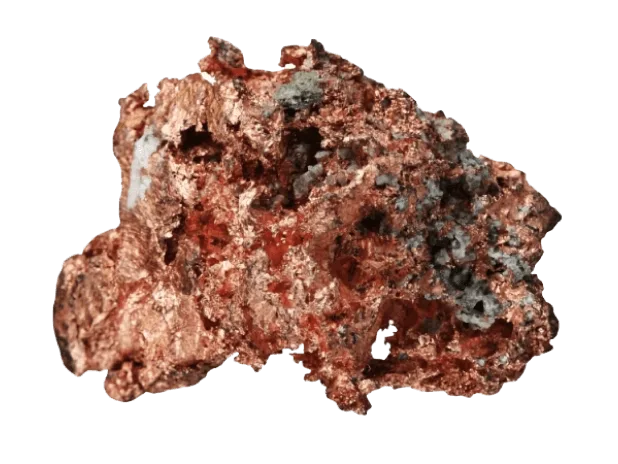
Copper
WORLD MINE PRODUCTION, 2025
23.2 million tonnes
Largest producer: Chile, roughly a quarter of supply
Market structure: contestable. No single country controls the midstream.
Source: International Copper Study Group, 2026
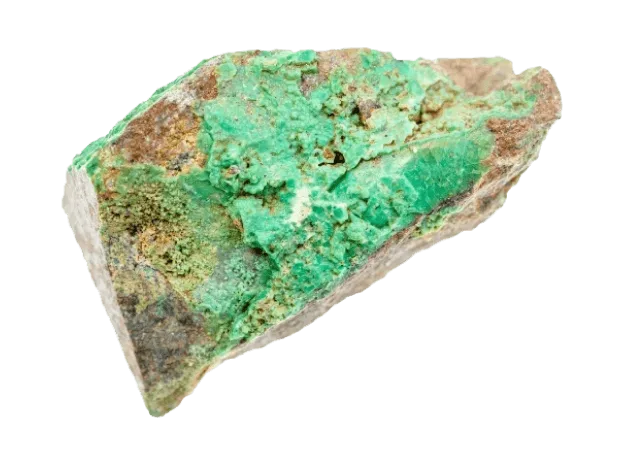
Nickel
WORLD MINE PRODUCTION, 2025
Approximately 3.9 million tonnes
Largest producer: Indonesia, roughly 65 percent of supply
Market structure: concentrated but open. Supply is now actively managed by quota.
Sources: US Geological Survey, Mineral Commodity Summaries 2026; industry estimates for 2025
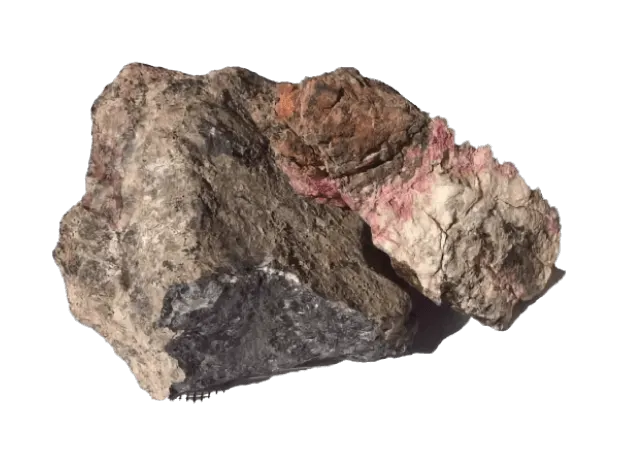
Cobalt
WORLD MINE PRODUCTION, 2025
310,000 tonnes
Largest producer: Democratic Republic of the Congo, roughly 74 percent of supply
Market structure: single point of failure. Export quotas since 2025 have repriced the market twice.
Source: US Geological Survey, Mineral Commodity Summaries 2026
What the Buildout Actually Consumes
A conventional data centre uses somewhere between 5,000 and 10,000 tonnes of copper. A single hyperscale AI facility can use up to 50,000 tonnes, and that is before counting the grid reinforcement required to feed it. The IEA expects global data centre electricity consumption to roughly double to 945 terawatt-hours by 2030. Wood Mackenzie puts copper demand for grid infrastructure alone at 1.1 million tonnes a year by that date, and notes that because copper is less than half a percent of a data centre's total project cost, developers building them are effectively indifferent to its price.
That is the unusual feature of this cycle. The marginal buyer of copper is no longer price sensitive. Meanwhile average copper ore grades have fallen from about 1.8 percent in 1900 to below 0.6 percent today, the thirty largest undeveloped greenfield projects will contribute roughly 14 percent of supply by 2035, and a copper mine now takes about 24 years from discovery to production.
Nothing in that sequence is solved by a higher price alone. It is solved by deposits that are already near surface, already drilled, and already in a jurisdiction that can permit and power them.
Sources: S&P Global, Copper in the Age of AI; IEA, Global Critical Minerals Outlook 2026; Wood Mackenzie, October 2025.
UNITED STATES
NOVEMBER 2025
Final 2025 List of Critical Minerals
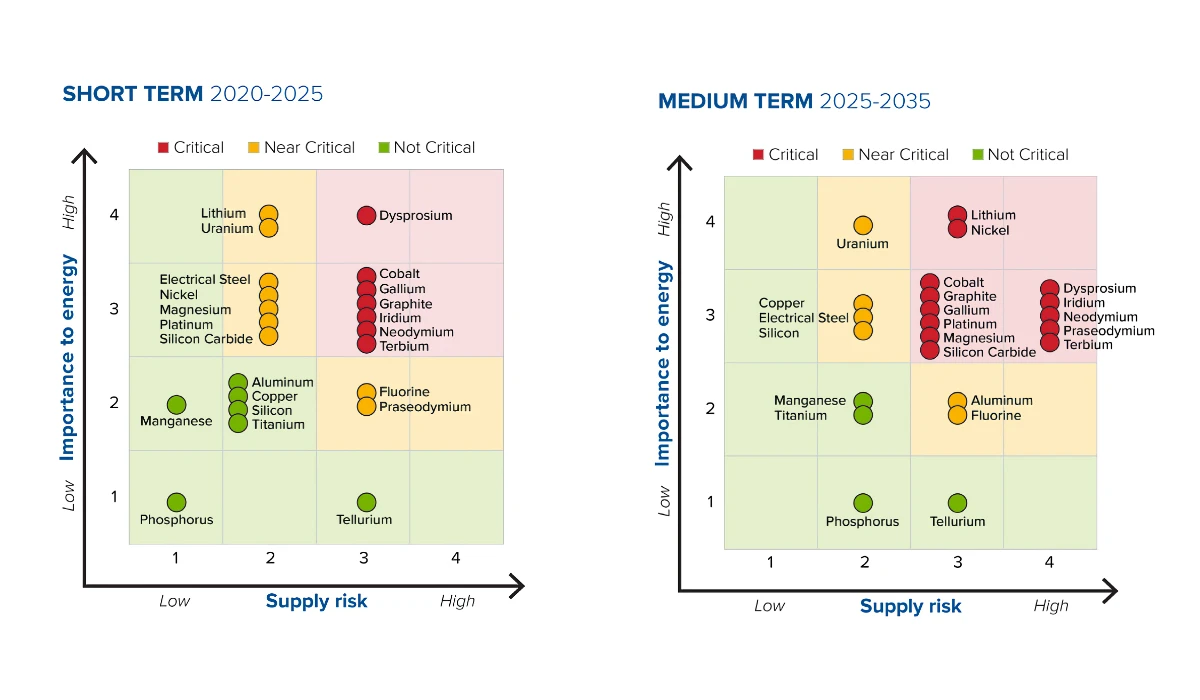
The US Geological Survey published its revised list on 7 November 2025, expanding it from 50 minerals to 60. Copper and silver were among the ten additions, alongside uranium, lead, potash, rhenium, silicon, boron, phosphate and metallurgical coal. The revised methodology explicitly weights the risk posed by insufficient domestic processing capacity rather than resource scarcity alone.
Source: Final 2025 List of Critical Minerals, Federal Register, 7 November 2025
CANADA
JUNE 2024
From Exploration to Recycling
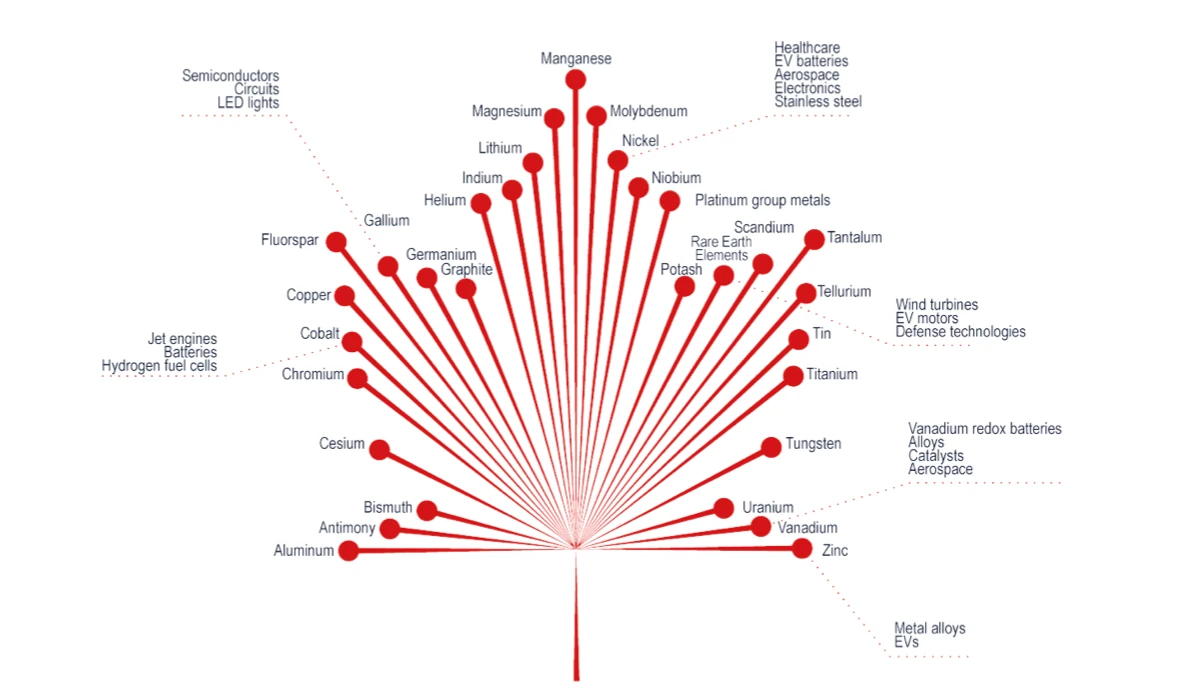
The Canadian government strategy aims to increase responsible production and develop domestic and global supply chains for critical minerals. This includes supporting exploration, accelerating projects, building infrastructure, workforce development, and global partnerships.
Canada has significant reserves of many critical minerals that are essential for clean energy technologies, electronics, and other applications. Developing this sector could boost Canada's economy and position it as a global supplier. Meaningfully engaging and collaborating with Indigenous peoples is a priority, and critical mineral development presents opportunities to grow Indigenous economies and partnerships.
Source: The Canadian Critical Minerals Strategy, Government of Canada
QUÉBEC
JANUARY 2026
Stratégie québécoise pour la valorisation des minéraux critiques et stratégiques 2025-2031
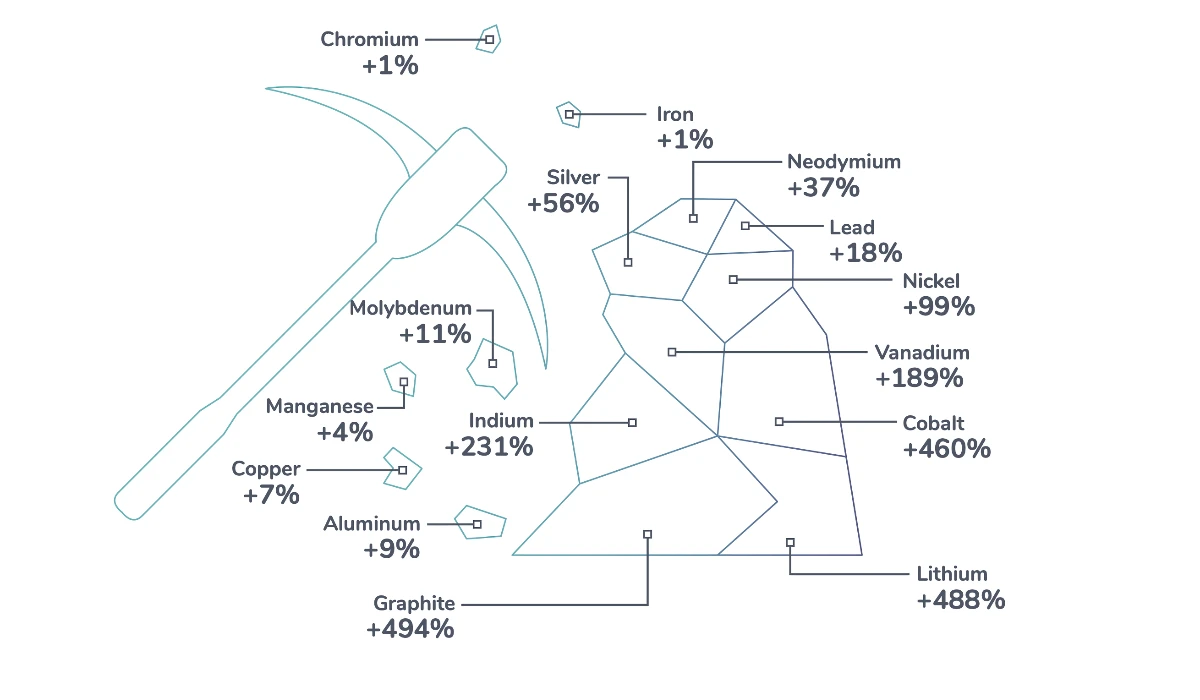
Québec's second-generation critical minerals strategy, launched in January 2026 with an $88.1 million action plan, moves the emphasis from exploration toward processing, recycling and project acceleration. It names artificial intelligence, defence and aerospace as the downstream sectors it intends to supply, and frames the whole programme as a matter of economic sovereignty rather than energy transition alone.
Source: Gouvernement du Québec
Antimony
Cobalt
Copper
Fluorspar
Gallium
Graphite
Lithium
Nickel
Niobium
Platinum Group Metals (PGMs)
Magnesium
Rare Earth Elements (REEs)
Silicon
Tantalum
Tellurium
Tungsten
Uranium
Vanadium
CRITICAL MINERALS INSTITUTE
JUNE 2024
First-Ever Critical Minerals List

The CMI tracks critical minerals designations across ten national lists in eight countries. Its own list of eighteen highlights how narrow the supply base is: China controls roughly 98 percent of gallium, 88 percent of magnesium, 81 percent of tungsten and 77 percent of graphite, while the DRC accounts for about 74 percent of cobalt and South Africa and Russia together for around 79 percent of platinum group metals.
Source: Critical Minerals Institute